

Three decades of property trends dispel myths, offer hints of the future
What can the previous 30 years of real estate market performance in Australia tell us about the future?
While bad news about the property sector continues to rock the boats of investors and developers, lashing at their hulls with headlines about a Spring season downturn and ongoing lack of supply and labour, decades of data points to an imminent recovery.
A CoreLogic study of 30 years of housing values offers some solace to those whose property prices have been retreating, finding that the past 30 years of peaks and troughs indicate the market will bounce back, albeit eventually.
The data demonstrates an ebb and flow to the Australian market cycles, with the promise over the long term of reliable growth.
“While housing values move through cycles of growth as well as declines, the long-term trend is undeniably upwards,” CoreLogic executive research director Asia-Pacific Tim Lawless said.
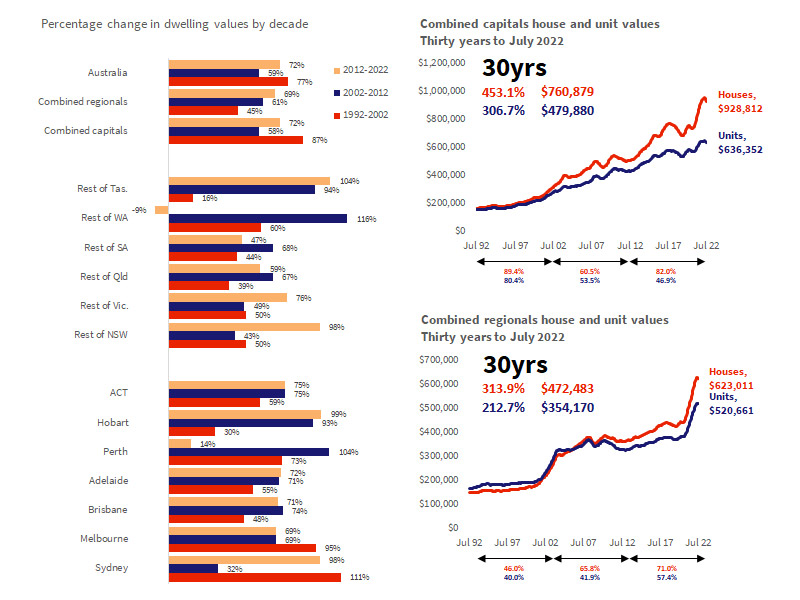
Over the past 30 years, dwelling values nationally have increased 382 per cent, or in annual compounding terms, by 5.4 per cent on average since July 1992.
“Overall, the long-term trends highlight the cyclical nature of housing markets.
“Changes in housing values over decades are a clear reminder that time in the market is more important than timing in the market,” he said.
Source: CoreLogic
On the Sunshine Coast, Queensland, Direct Collective’s Director Mal Cayley, who specialises in researching local real estate and property data, says the East Coast market’s past, however, may not be repeated in the future.
“It’s actually redundant for us to have a discussion around property at a macro point of view and talk about how it’s going to perform over 30 years, because the next 30 years is going to be very different from a global and a geopolitical environment to the last 30; very, very different.
“From a property investor point of view it always comes down to what is happening in a specific market around the three drivers; economy, demand and supply, and then being able to understand and look forward – not backwards – to what are the factors that will create change in those three areas over the short, medium and long term, because that’s how you make sound investment decisions,” Mr Cayley said.
A myth dispelled
CoreLogic acknowledge in their report that forecasting where housing trends are going is hard enough over the short-term, let alone over the next 10, 20 or 30 years.
“The decline trend we are seeing at the moment will eventually level out followed by a period of stability then further growth,” Mr Lawless said.
“Analysing each downturn across the combined capitals from the early 1980s shows the longest period of falling values has been 21 months, recorded over the most recent down phase (2017-2019) and also through the 1989-91 downturn.”
Secondly, the data dispels a commonly held belief that housing values double every 10 years.
“You might need to think again - none of the capital cities recorded a doubling in dwelling values over the past 10 years (the closest was Sydney at 97.6 per cent growth), and over the previous decade (2002-2012), Perth and Darwin were the only capital cities to double in value with gains of 103.8 per cent and 105.5 per cent respectively.

Tim Lawless, Executive Research Director - Asia Pacific, CoreLogic
“For those looking to double the value of their asset over a decade they will need to be outperforming the broader average,” Mr Lawless said.
The research confirmed the average dwelling is kept for nine years before being sold, shown by recent growth figures that indicate only 6.3 per cent, or 620,000 of all 10.8 million dwellings in Australia, turned over in one year in the same period.
“Over the past decade, none of the capitals and only one regional market (regional Tasmania) recorded a growth rate of 100 per cent or higher,” Mr Lawless said.
“In the previous 2002-2012 decade it was only Perth and Darwin where housing values doubled.”
Melbourne has consistently achieved housing value growth of 459 per cent, at 5.9 per cent per annum, over the past 30 years. Outside metro areas, regional Tasmania housing values rose 361 per cent or 5.2 per cent per annum.
The lowest 30-year growth rate of all capitals is found in Perth, with 303 per cent or 4.8 per cent per annum, and regional Western Australia at 214 per cent or 3.9 per cent per annum.
In terms of growth over the past 30 years, Sydney suburbs listed in the top 20 capital city regions highlight the differences, such as Ryde-Hunters Hill, which grew 587 per cent with a dollar value change of $1.9million, Eastern Suburbs North, a 642 per cent growth and dollar value change of $3.8 million, and Marrickville/Sydenham/Petersham with 660 per cent growth and $1.5-million-dollar value change over 30 years.

Mal Cayley, CEO, Direct Collective
“Using macro data to talk about an understanding of what’s happening in any market, even the graphs shown in the report shows there’s no such thing as a Sydney market, for example, because certain regions of Sydney performed very, very differently,” Mr Cayley said.
The Long Game research does acknowledge the impacts of local market dynamics over time.
“The mining boom and subsequent bust in WA saw Perth housing values rise by 104 per cent between 2002 and 2012, but today’s values are only 14 per cent higher over the current decade (2012-2022).
“In Hobart, the 1992-2002 period was the weakest of the three decades analysed, with values up 30 per cent, while the most recent 10 years has seen Hobart housing values surge 99 per cent on the back of stronger migration and an ongoing undersupply of housing,” the research said.
“The very premise that the last 30 years in anything that we’re looking at can indicate the next 30 years, it’s fundamentally flawed because the world as we know it is now more reflective of the pre-1990s, in particular of the 1940s and ‘50s, than the last 30 years,” Mr Cayley said.


