")
")
The small factor causing a seismic shift in rental market
The rental crisis is caused by an array of factors, but its longevity is being driven by one small variable that's having an outsized impact.
One of the tasks of being the CEO of a property advice firm is that each month I sit down and read the latest reports published by Australia’s property data companies.
Auction clearances, days on market, the eight capital cities’ median price growth – it’s all essential knowledge when you’re helping people make informed decisions about property.
Typically, the rental data is the most stable. A key indicator is the vacancy rate, which tends to move between 2 and 3 per cent, a band showing a balance of power between landlords and tenants.
When this balance prevails, asking rents tend to slide along at the inflation rate for that year.
And then there’s the number of properties put up for rent each year, a figure that typically goes up or down 1 to 2 per cent.
Rents hit by lightning in clear blue sky
It was reading the rental data in July 2022 that I first got a warning that something had changed dramatically.
A number flashed out at me and at first, I thought it must be wrong. But it proved to be correct. The number of properties put up for rent in the year to June 2022 was down by 13.8 per cent.
A rise or fall of 4 per cent would be a standout and make you think some new trend may be afoot. But a fall of 13.8 per cent is something of an entirely different order.
It meant the number of rentals available was contracting so fast the market was on the verge of a major shift.
It’s not that unusual to see a metropolitan area experience a rental vacancy rate of 1 per cent but typically these shortages are temporary and contained to one or two metro areas.
This time it’s very different. All of Australia’s major urban centres are reporting vacancies around 1 per cent and that level has been sustained for 15 months.
The Airbnb effect
We have to go back to the pandemic to see how this change came into play. With international borders shut, Australians indulged in interstate travel – and where better to stay than in short term rental accommodation (STRA).
That attracted the interest of landlords, who found a property listed on a short-term accommodation app could deliver three to four times what it would from a standard 12-month lease.
While much of the media commentary tags STRAs as just a coastal resort phenomenon, that’s hardly the case.
In New South Wales for instance, inner city and suburban locations are prominent among areas with a strong movement from rental properties to STRAs.
| Suburbs | Total STRA registrations | STRA as % of total private dwellings |
|---|---|---|
| Shoalhaven | 4,175 | 7.5% |
| Central Coast | 3,307 | 2.3% |
| Northern Beaches | 2,514 | 2.5% |
| Byron | 2,440 | 16.0% |
| City of Sydney | 2,258 | 1.9% |
Source: NSW Department of Planning, T Rose.
In many suburban areas, rentals make up only a quarter or less of dwellings. So, while the percentage of STRAs in coastal areas tends to be higher, a movement of 1 per cent or 2 per cent of properties in an inner city or suburban area to the STRA market will have a big impact.
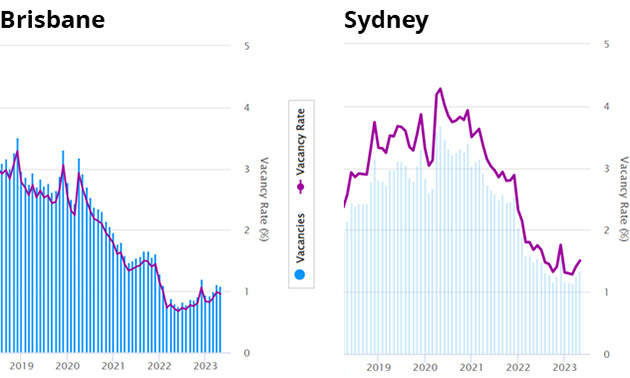
Take a look at this playing out in Brisbane and Sydney. While both cites forged different trends before, in 2020 and 2021 there was a sharp contraction in the vacancy rate.
And bear in mind this was when international borders were shut and both cities’ populations were declining slightly.
Source: SQM
Rental crisis a global phenomenon
The impact STRAs in urban areas is two-fold; it reduces the number of available rental properties and it skews investment away from the construction of new properties.
That impact can be seen around much of the developed world.
In New York City, the Comptroller’s Office published a report saying the “increase of Airbnb supply cost New Yorkers a total $616 million in additional rent in 2016 as a result of price pressures.”
In Portugal, the government has announced a series of measures to tackle the housing crisis, including a ban on new STRA licenses.
And in Italy, the government has unveiled plans to restrict STRAs to address their housing crisis.
Short-term rentals, long-term impact
The movement of a relatively small number of properties to STRA has changed the dynamic for renters, who used to be able to rely on a predictable supply of properties and moderate increases in rents.
Now add into this equation a resumption of Australia’s migration program and the impact is plain to see.
Take a look at the postcode areas with the lowest vacancy rates for units provided exclusively by CoreLogic’s data team.
What’s striking is that it’s a mix of mostly suburban areas where the pinch is greatest.
| Suburbs | Median weekly rent | Rent rise/fall 12 months | Vacancy (May 23) | Vacancy (May 22) |
|---|---|---|---|---|
NSW - Units |
||||
| Croydon | $627 | 22.4% | 0.2% | 2.1% |
| Punchbowl | $477 | 20.2% | 0.2% | 3.0% |
| Eastern Creek, Rooty Hill | $551 | 10.0% | 0.2% | 1.5% |
| Como, Jannali | $578 | 8.5% | 0.3% | 1.8% |
| Lakemba | $456 | 24.2% | 0.3% | 3.3% |
| Northmead | $549 | 16.4% | 0.3% | 1.3% |
| Lucas Heights, Menai | $713 | 11.9% | 0.3% | 1.1% |
| East Hills | $585 | 15.5% | 0.3% | 1.2% |
| Penshurst | $546 | 22.6% | 0.3% | 1.8% |
| Allawah, Carlton | $600 | 26.6% | 0.3% | 2.2% |
Victoria - Units |
||||
| Doncaster East | $608 | 15.7% | 0.1% | 0.9% |
| Gladstone Park, Tullamarine | $436 | 11.9% | 0.1% | 2.1% |
| Pakenham | $395 | 10.7% | 0.2% | 0.5% |
| Ashburton, Ashwood | $638 | 10.7% | 0.2% | 1.5% |
| Clifton Hill, Fitzroy North | $597 | 17.0% | 0.2% | 1.9% |
| Mitcham | $502 | 9.1% | 0.2% | 1.1% |
| Boronia | $465 | 8.1% | 0.2% | 0.7% |
| Moorabbin | $517 | 8.5% | 0.2% | 1.9% |
| Vermont | $543 | 10.7% | 0.2% | 1.7% |
| Greensborough, Briar Hill | $475 | 8.5% | 0.3% | 1.6% |
Queensland - Units |
||||
| Corinda, Graceville | $510 | 11.3% | 0.2% | 0.7% |
| Bray Park, Cashmere | $463 | 15.2% | 0.3% | 0.7% |
| Yeronga | $529 | 12.5% | 0.3% | 0.6% |
| Forestdale, Hillcrest | $427 | 16.9% | 0.3% | 1.0% |
| Aspley, Boondall | $483 | 13.9% | 0.3% | 0.5% |
| Murarrie | $649 | 14.3% | 0.3% | 0.6% |
| Kippa-Ring | $436 | 22.6% | 0.3% | 0.3% |
| Moorooka, Tennyson | $518 | 15.6% | 0.3% | 0.5% |
| Fitzgibbon, Taigum | $486 | 15.1% | 0.3% | 0.5% |
| Shailer Park | $433 | 15.1% | 0.3% | 0.3% |
Source: CoreLogic
Quite clearly, the 2020 and 2021 rise in STRAs followed by the increased demand from migrants over the last year has seen a big impact where those two factors combine.
And that is in capital cities, where rents recorded the highest increase since records began at 11.7 per cent over the last 12 months, compared to an average of 3.5 per cent.
And it’s Sydney and Melbourne with the strongest growth, with Sydney recording a whopping 19.1 per cent jump and Melbourne not far behind at 15.2 per cent.
Where does rental shift leave property investors?
The most important takeout for investors is that the equilibrium that has guided the rental market for the last 40 years has changed.
Any investor considering a property now should take into account how well suited it is to the local short term accommodation market.
And when we combine the current low vacancy rates with Australia’s migration program, it’s plain to see that rents will continue to climb.
Investors should still assess a property first for its potential for capital growth and rental returns second, but the rental factor is now much more important than ever before.


")


