

National property market sheds a quarter of its earlier gains
National property prices fell in November for the seventh month in a row, and although there were signs of the declines slowing the average dwelling has still dropped $53,400 in value since the market's peak.
Australian properties have now lost a quarter of the huge gains that had been made up to the market’s peak in April.
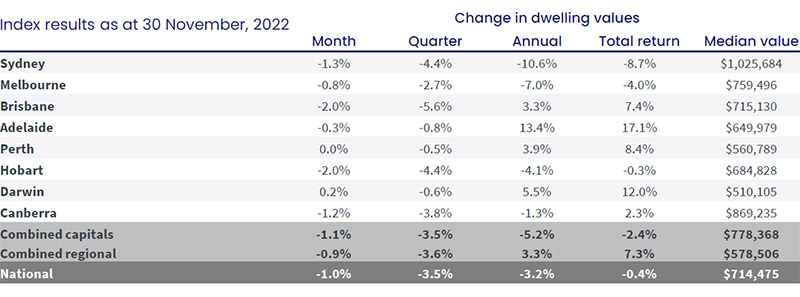
National property prices fell in November for the seventh month in a row, easing another 1.0 per cent.
Dwelling values in Australia are now down 7.0 per cent, or $53,400, since the upswing that had delivered massive gains of 28.6 per cent.
Although values are continuing to trend lower, the rate of decline has been consistently moderating since the national index dropped by 1.6 per cent in August.
Falls were not as widespread as last month when every capital city recorded property price falls.
Brisbane and Hobart (both down 2.0 per cent) led the monthly rate of decline in November, while at the other end of the spectrum, Perth values held firm and Darwin nudged 0.2 per cent higher over the month, according to CoreLogic’s national Home Value Index (HVI).
CoreLogic’s Research Director, Tim Lawless, said the easing in the rate of decline is mostly emanating from the Sydney and Melbourne markets, but is also evident across many of the smaller capitals and most regional markets.
“Three months ago, Sydney housing values were falling at the monthly rate of 2.3 per cent. That has now reduced by a full percentage point to a decline of 1.3 per cent in November.
“In July, Melbourne home values were down 1.5 per cent over the month, with the monthly decline almost halving last month to 0.8 per cent,” he said.
The rate of decline has also eased across the ACT (from a 1.7 per cent fall in August), and is no longer accelerating in Brisbane. Most of the broad rest-of-state markets have also seen the pace of declines decelerate.
Sydney remains the only city where housing values have fallen by more than 10 per cent from their peak.
Due to a weaker upswing, Melbourne values are only 2.8 per cent above where they were at the onset of Covid.
Most of the other capital city and broad rest-of-state regions are still recording dwelling values at least 25 per cent above March 2020 levels.
Source: CoreLogic.
“Potentially we are seeing the initial uncertainty around buying in a higher interest rate environment wearing off, while persistently low advertised stock levels have likely contributed to this trend towards smaller value falls, however, it’s fair to say housing risk remains skewed to the downside while interest rates are still rising and household balance sheets become more thinly stretched,” Mr Lawless explained.
“There is still the possibility that the pace of declines could reaccelerate, especially if the current rate hiking cycle persists longer than expected.
“Next year will be a particular test of serviceability and housing market stability, as the record-low fixed rate terms secured in 2021 start to expire,” he said.
Listless market
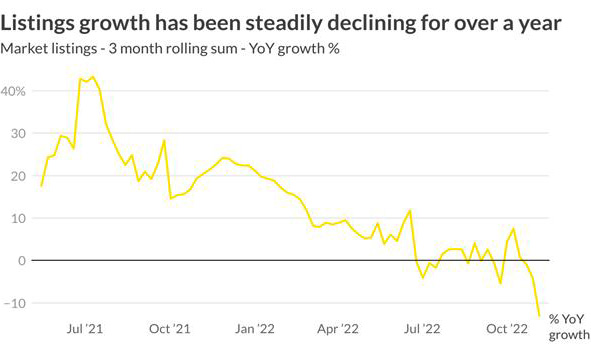
Market listings growth has been steadily declining for the last year, with a peak year-on-year growth in listings seen in July last year.
Growth in the regions could not offset large declines in both Melbourne and Sydney. All state capitals had a decline except for Canberra with an increase of 0.5 per cent year-on-year growth.
The last three months have seen a decline in listings brought on by extended increased interest rates slowing down house price growth and lowering the incentive for households to sell.
Source: CoreLogic.
While advertised supply levels are lower than normal, so too is housing demand. Capital city home sales were estimated to be 23.2 per cent lower than a year ago and 1.6 per cent below the previous five-year average over the three months to November.
Over the four weeks ending November 27, the flow of new capital city listings was 30.8 per cent lower than a year ago and 14.2 per cent below the previous five-year average.
The largest fall in estimated home sales has been across Sydney, where the number of sales is down 38.6 per cent relative to the same time last year and 23.9 per cent below the previous five-year average. Melbourne sales have also fallen sharply, 33.8 per cent lower than a year ago and 15.5 per cent below average. Brisbane sales are down 18.4 per cent on last year.
More renters
Rental markets around Australia remain extremely tight, with vacancy rates holding around 1 per cent or lower in most regions.
Vacancy rates have been driven lower by a combination of low rental supply against a backdrop of rising rental demand due to the strong rebound in net overseas migration.
Nationwide, the proportion of households renting is on the rise, having increased from 26 per cent to 31 in the past 15 years.
Over the same period, the proportion of public housing tenants almost halved, from 5.5 per cent to 2.9 per cent.
Housing costs for renting households have also increased over the same period, relative to owners. Renters currently spend an average of 20 per cent of their income on housing costs, while owners with a mortgage pay 15.5 per cent, according to the Rental Affordability Index released this week by SGS Economics and Planning.
The Australian Housing and Urban Research Institute (AHURI) estimates that 1.3 million households need additional housing assistance.
The number of capital city homes advertised for rent reached a decade low through November and regional rental ads have not been this low since 2009.
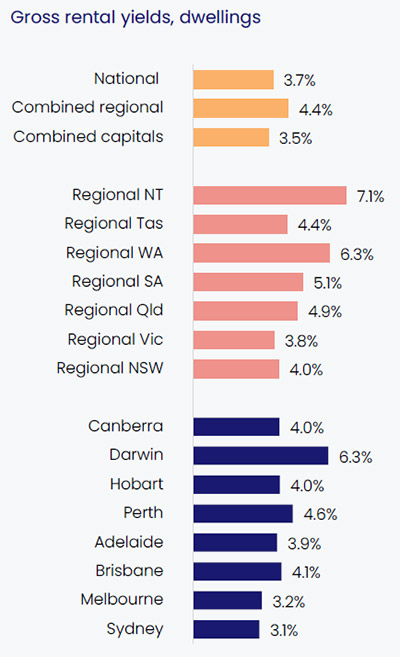
Gross rental yields across the combined capitals rose to 3.50 per cent in November, up from a recent low of 2.96 per cent in February and only 17 basis points below the decade average (3.67 per cent).
Source: CoreLogic.
Despite such tight rental conditions, there is some evidence that rental growth is easing across some cities.
The quarterly trend in capital city rental growth peaked at 3.1 per cent in July and has since reduced to 2.5 per cent, according to CoreLogic.
“The softening in rental growth is more apparent for house rents than units,” Mr Lawless said.
“This could be a sign that rental demand is transitioning towards more affordable rental options such as the higher density sector.
“It could also reflect a reversal of the pandemic trend towards smaller rental households.
“As tenancy costs rise and renters struggle with affordability pressures, it’s logical that households would seek to maximise the occupancy of the dwelling in order to spread higher rental costs across a larger number of tenants.
“Finally, there may be some rental demand easing in the detached house segment as the large backlog of housing construction projects is completed.”
National spokesperson for Everybody’s Home, Maiy Azize, said it’s a national shame that our wealthy, lucky country has so many people struggling to live safely and affordably.
“Australia’s housing crisis has reached fever pitch. No part of the country has been spared. Rents are shooting up in towns and regions, and our cities have never been more expensive.
“It’s clear that the chronic underinvestment in social and affordable housing over the past decade has created a domino effect of housing stress in all corners of the country.
“Stagnant wages, low rental vacancy rates and rising interest rates all add to rental stress but the huge shortfall in social and affordable housing is one of the biggest drivers.”
Ms Azize said the state and federal governments needed to build at least 25,000 social and affordable houses each year to keep up with demand.


