")
")
Is Sydney versus Melbourne still a one-sided property race?
Melbourne property prices have failed to keep pace with Sydney and other capital cities since Covid but the Victorian capital may be poised to strike back as a property investment prospect.
It may take around 40 years to pay off a home on the average salary in both cities, but that isn’t enough to stifle a Sydney-Melbourne rivalry that transcends sport and culture to include their respective property markets.
In a rivalry that purportedly dates back to the to 1871 when the very first intervarsity competitions in Australia were a boat race and cricket match between their two great universities, Melbourne won both inaugural events.
Sydney had long been the most populous city but that recently changed too when Melbourne was this year deemed to have overtaken the Harbour City.
But when it comes to property prices, Sydney’s mantle as the priciest real estate remains unchallenged and it is seemingly extending its lead over its southern neighbour.
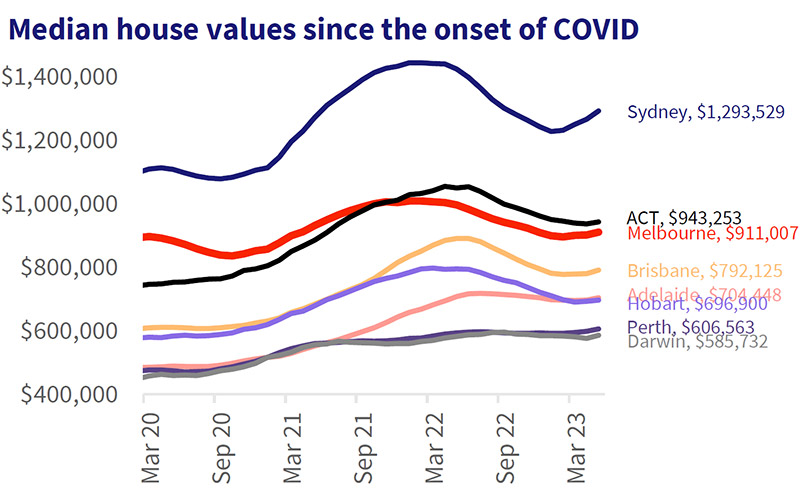
Property prices since the onset of Covid have seen the two cities take divergent paths.
Source: CoreLogic
Melbourne house values have increased a mere 1.6 per cent between March 2020 and the end of May 2023. Every other capital city has seen double-digit growth, ranging from a 16.5 per cent gain in Sydney to a 45.2 per cent surge in Adelaide house values during that period.
But while Melbourne may be lagging the New South Wales capital, investors could be licking their lips at the prospect of investing in a city with high population growth and relative affordability compared to Sydney.
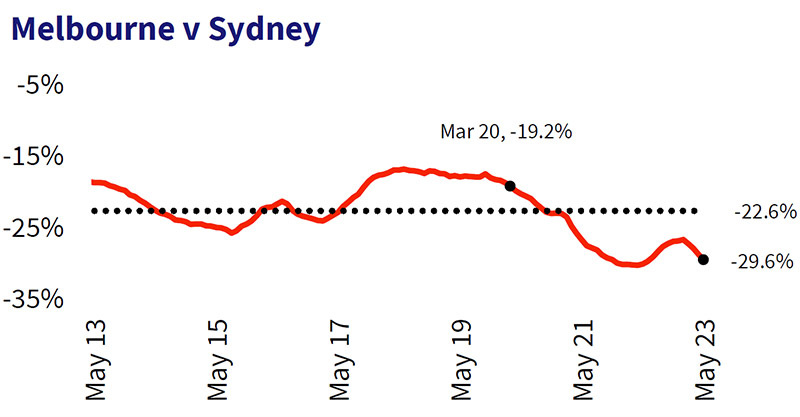
According to CoreLogic, at the onset of Covid Melbourne house values were 19.2 per cent cheaper than Sydney’s. By April 2022 the gap between Sydney and Melbourne house values had blown out to 30.3 per cent, the biggest divergence since May 2006.
The gap has closed a little since then however Melbourne’s median house value was 29.6 per cent behind Sydney’s in May 2023, the dollar equivalent of $382,500.
Every capital city other than Canberra – the country’s second most expensive capital for houses – has significantly closed the house value gap to Melbourne. At the onset of the pandemic, Brisbane houses were 47 per cent cheaper than Melbourne. That affordability gap has closed to just 15 per cent.
| Melbourne vs | Difference in median house value - March 2020 | Difference in median house value - May 2023 | $ difference with Melbourne – May 2023 |
|---|---|---|---|
| Sydney | -19.2% | -29.6% | $382,500 |
| Canberra | 20.1% | -3.4% | $32,200 |
| Brisbane | 47% | 15% | -$118,900 |
| Adelaide | 85% | 29.3% | -$206,600 |
| Perth | 88.2% | 50.2% | -$304,400 |
| Hobart | 54.5% | 30.7% | -$214,100 |
| Darwin | 95.7% | 55.5% | -$325,300 |
Tim Lawless, Research Director, CoreLogic Asia Pacific, said Melbourne may still have a competitive edge in terms of future capital growth performance.
“With housing affordability remaining stretched, this improvement in Melbourne’s value proposition could place the city in a more competitive position to attract a greater share of housing market participants.
“The city’s advertised supply level is trending lower and is 13.4 per cent below levels at the same time last year and 7.0 per cent below the previous five-year average.
“Melbourne’s rental vacancy rate of 0.8 per cent in May is also one of the lowest in the country and yet another potential factor supporting purchasing demand for those with the financial capacity to enter the market,” Mr Lawless said.
He did add however that the outlook wasn’t necessarily as smooth as an MCG cricket pitch on Boxing Day.
“Whether Melbourne’s strong demand, low supply and a relative affordability advantage can completely offset the impact of high interest rates remains uncertain,” he said.
“Demand from overseas migration is likely to remain a feature of the market for the next few years, however, borrowers’ access to credit will be challenging while interest rates are high.”
Melbourne was 85 per cent more expensive than Adelaide at the start of Covid but the gap has narrowed to just 29 per cent and in Perth, where the gap was 88 per cent, Melbourne house values are now 50 per cent higher.
Source: CoreLogic
Melbourne’s softer housing market conditions through the pandemic cycle coincided with a sharp drop off in demographic trends, according to Mr Lawless.
Both net overseas and interstate migration rates fell sharply through the pandemic, reaching record lows, detracting from housing demand amid a series of lockdowns associated with the pandemic.
“Demographic data to September 2022 shows Victoria’s interstate migration is normalising and was almost back in positive territory (-484 net interstate migrants).
“With demographic data for Q4 2022 to be released soon, it’s likely Victoria will be once again have reached a positive interstate migration position, putting an end to 10 consecutive quarters of decline.
“With Australia’s annual net overseas migration surging to new record highs and Victoria’s first possible rise in interstate migration since Q1 2020, housing demand across Melbourne has begun to strengthen substantially.”
A Melbourne-based property consultant for aussieproperty.com, said they expected the next year or two to deliver strong growth in Melbourne’s apartment sector and within the CBD due to investors seeking the higher rental yields on offer and surging migration.
“The recent upward trend in overseas migration back into Melbourne has the potential to further bolster the apartment sector, particularly considering the prevailing challenges faced by construction projects across the state.
“With more people choosing Melbourne as their destination, there is an increased demand for housing, including apartments in the inner city, however, the supply of new apartments is likely to be constrained due to disruptions in supply chains and builder insolvencies impacting construction projects across the state.
“This limited supply, coupled with the growing demand from incoming migrants, can potentially drive up the value and desirability of existing apartments.
“Investors may find this trend advantageous as they can capitalise on the potential for price appreciation and rental income, given the restricted availability of new construction projects,” they said.
40 years to pay off a home
Buyers looking to enter the market do, however, still face serious affordability issues.
New research from Proptech platform HtAG Analytics found that housing affordability has continued to decline, with the number of years it takes to pay off and own a property in Sydney and Melbourne ballooning to 40 years.

Alex Fedoseev, Co-founder, HtAG Analytics
Their analysis was based on the number of years it would take a homebuyer to fully repay their home loan based on median home prices and median family income levels in their suburb of residence.
Sydney suburb Strathfield was in a league of its own as the least affordable suburb in the country based on income levels, requiring an astonishing 140 years to pay off based on residents’ current income levels.
New South Wales was found to be the country’s most unaffordable housing market, taking on average 42 years to pay off a free-standing house based on the median family income.
Victoria was second at 39 years and Tasmania third at 38 years. All the major capital cities required a mortgage holder to spend 25 to 30 years paying off a mortgage.
For units, Soldiers Point in northern NSW (82 years to own), Noosa Heads in Queensland (75 years) and Byron Bay in NSW (74 years) proved to be the most unaffordable markets.
While they may be rivals, Sydney and Melbourne had much in common.
HtAG Analytics co-founder, Alex Fedoseev said the two cities’ property markets have now reached an unaffordable level compared to the rest of the country.
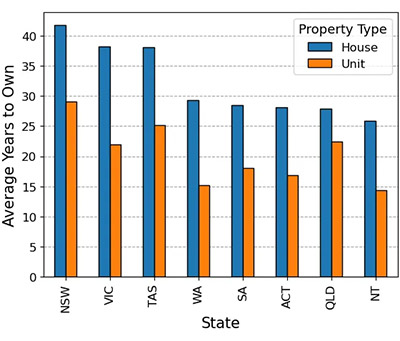
“In states like South Australia and Queensland, the gap between owning a house and a unit is relatively smaller, indicating a more balanced property market,” Mr Fedoseev said.
“In contrast, New South Wales and Victoria exhibit a larger disparity, demonstrating the dominance of higher-priced houses in those markets.”
Mr Fedoseev said two common factors contribute to the consistent unaffordability of suburbs with years to own above 100, namely high house prices coupled with a prevalence of renters or exclusive locations with generational wealth.
“In these markets, a significant portion of the population is engaged in renting units rather than owning a house,” he said.
“While the majority of household incomes in these suburbs may suffice for renting or owning a unit, they may not be adequate for purchasing houses.
“This leads to a property market that primarily supports rental properties in units and maintains high house prices.”


")


