

National unit prices rise for first time in almost a year
Six of the eight Australian capitals saw unit prices increase, as apartment values nationally rose for the first time in 11 months.
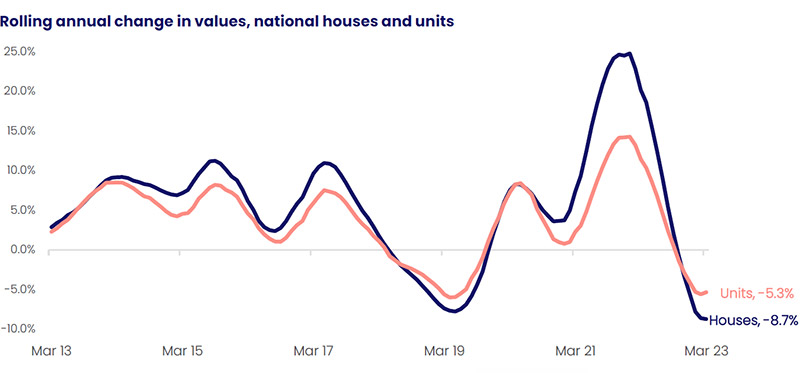
Unit prices in Australia increased 0.6 per cent over March, rising for the first time in 11 months.
Following last month’s flat result, March’s uptick took unit values just 0.4 per cent lower over the quarter and saw the annual decline trend reduce from 5.6 per cent over the 12 months to February to a 5.3 per cent fall over the year to March.
The subtle increases seen in Sydney unit values a month earlier became more geographically broad-based, with six of the eight capitals recording a monthly rise in unit values.
CoreLogic Economist Kaytlin Ezzy said excess demand from the extremely tight rental market, strong overseas migration, and the tonal shift and subsequent pause in rate hikes from the RBA, had likely put upward pressure on demand while total unit listing levels remain well below average.
With a similar monthly rise recorded in national house values (0.6 per cent), the uptick has many wondering if we have passed through the bottom of the market downturn.
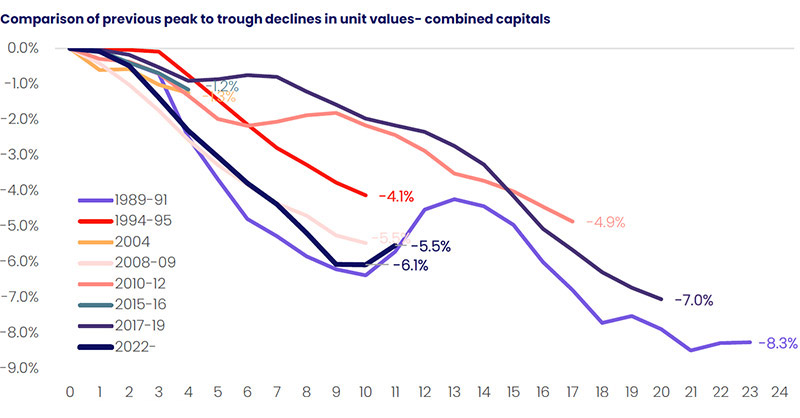
“It’s looking increasingly like we have moved through a trough in unit values, however a number of headwinds are still apparent, including further rate rises, an expectation for weaker economic activity through the year and the potential for a lift in advertised stock levels, however, as we move through a possible inflection point, it can be useful to compare the current unit downswing to both previous periods of value decline and to the cumulative value drops seen in the house market,” Ms Ezzy said.
Source: CoreLogic
In January, the cumulative decline in national dwelling values overtook the 2017-2019 downswing as the largest decline on record, with the trend in dwelling values pulled down by the 9.7 per cent fall in house values seen through the first nine months of the downswing (increasing to a 9.9 per cent decline over the first 10 months).
By comparison, the 6.1 per cent drop in national unit values between April 2022 and January 2023 was moderate relative to both the house value falls and to previous unit peak-to-trough declines.
Yearly unit price falls not the biggest
Unlike the house and broader dwelling market, the decline seen in unit values since April 2022 is behind both the 1989-91 downswing (-8.3 per cent) and 2017-19 drop (-7.0 per cent) in terms of cumulative decline, and also behind 1989-91 in terms of speed.
“If this month’s improvement in values isn’t a false start, it’s likely we won’t see much momentum in the recovery phase until a catalyst for a new growth phase becomes apparent,” said Ms Ezzy.
“For example, a decrease in interest rates, renewed fiscal stimulus such as first home buyer incentives, or an easing in credit policies such as a reduction to APRA’s serviceability buffer could see an increase in housing demand.”
Source: CoreLogic
The shift to a more positive trend in unit values was geographically broad-based, with both the combined capitals (0.6 per cent) and combined regional (0.2 per cent) markets recording a monthly rise in values.
After recording a mild 0.1 per cent increase in unit values through February, Sydney recorded the strongest monthly growth in unit values across the capitals, up 1.0 per cent, followed by a 0.4 per cent lift in Melbourne.
Brisbane, Adelaide, and Perth unit values all saw a 0.2 per cent rise in March, while Canberra recorded a mild 0.1 per cent increase.
Hobart (-0.4 per cent) and Darwin (-0.6 per cent) were the only capitals to record a monthly decline in unit values, with the pace of decline holding steady with the previous month.
“Given that upper quartile markets typically lead both the up and down swing, it’s unsurprising that Sydney unit values are recording the strongest growth among the capitals.”
Unit rent rises outpace houses
With a median value of more than $775,000, units across Sydney are more expensive than the median house values of Brisbane ($772,020), Adelaide ($694,818), Hobart ($691,859), Perth ($593,385) and Darwin ($582,415).
National unit rents continue to rise at roughly twice the pace of house rents, up 1.6 per cent and 0.8 per cent over the month and 3.9 per cent and 2.0 per cent, respectively, over the first quarter.
Source: CoreLogic
Driven by the strong return of overseas migrants and international students, the combined capitals recorded its strongest quarterly increase in unit rents on record, rising 4.4 per cent over the three months to March, equivalent to a $23 per week increase in the average rental value ($550).
“The mismatch between rental supply and demand has seen capital city rental growth reaccelerate, which will be unwelcome news to many tenants already struggling to find affordable rental accommodation,” she said.
Amid record levels of net migration, the total number of advertised capital city rental listings over the four weeks to April 2nd was 38.1 per cent below the previous five-year average, equivalent to a shortfall of roughly 42,000 rental listings.
Of this shortfall, approximately 65 per cent are in the unit sector, with total capital city unit rental listings down 43.2 per cent or 27,332 from the average level typically seen this time of year.
This has seen capital city unit vacancy rates fall to a new record low of 0.8 per cent in March, while houses recorded a similar record low vacancy rate of 1.1 per cent.
Source: CoreLogic
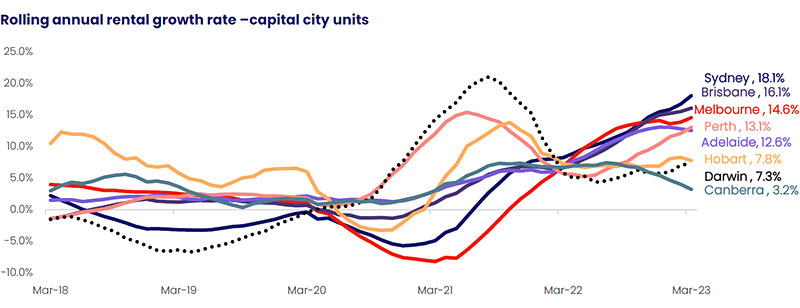
Looking across the individual capital city unit markets, Sydney (5.3 per cent) and Melbourne (4.3 per cent) recorded new record peaks in their quarterly rental growth trend, with the majority of overseas migrants settling in the two largest cities.
Unit rents in Perth, Brisbane, Hobart and Adelaide rose by 4.6 per cent, 3.5 per cent, 3.4 per cent and 2.2 per cent over the first quarter. Canberra recorded a mild increase of 0.5 per cent, while Darwin saw unit rents decrease 0.4 per cent over the three months to March.
“While units across each of the capitals and rest-of-state regions still offer a more affordable rental alternative compared to houses, the stronger rental growth seen in the medium to high-density sector, in part due to their relative affordability, has seen the gap narrow.
“At the capital city level, the gap between the median house and unit rental value has narrowed from $85 this time last year to $65 in March.”
Positive outlook for apartment market
Moving forward, the outlook for Australian unit values is starting to look more positive, with this month potentially signalling a change in the direction of values, however, there are still some challenges ahead.
“Arguably we are yet to see the full impact of interest rate rises, with many fixed-rate loans only now starting to expire, while three of Australia’s four major banks still expect the cash rate to rise a further 25 basis points in the coming months.”
“Additionally, while listing levels are currently holding low, we could see listing levels rise, which would add downward pressure on values if not met with an equivalent rise in demand but on the flipside, we could see this month’s rise in values become the start of a slow recovery phase, with inflation seemingly moving past its peak and consumer sentiment rising from near-record lows.”


