

Sydney, Brisbane lead the charge as property prices keep rising
House prices continue to outperform units, with Brisbane and Sydney reclaiming the values lost in 2022.
Property prices leapt 1.5 per cent in Brisbane and 1.1 per cent in Sydney in August as national property prices recorded their sixth successive month of increases.
Houses continue to outperform units, with values are up 6.3 per cent since bottoming out in February, compared with a 4.9 per cent rise in unit values.
This shift comes after house values were down 10.7 per cent compared with a 6.5 per cent drop in unit values in that period.
Hobart was the only state capital not to register an increase in dwelling values in August, down 0.1 per cent.
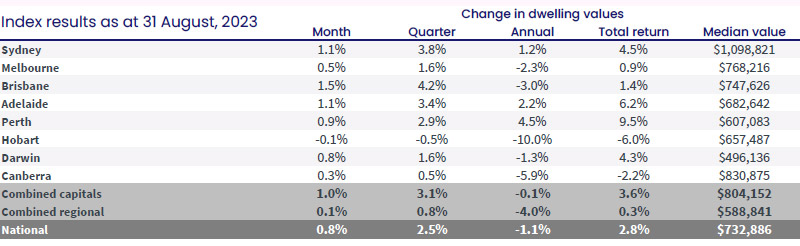
Source: CoreLogic
CoreLogic Research Director, Tim Lawless, noted the trend in housing values, although generally positive, is diverse.
“Sydney has led the recovery trend to-date with a gain of 8.8 per cent since values found a floor in January this year,” he said.”
Brisbane has also posted a strong recovery with values up 6.2 per cent since bottoming out in February.
“At the other end of the scale, some other capital cities are better described as flat, with Hobart home values unchanged since stabilising in April, while values across the ACT have risen only mildly, up 1.0 per cent since a trough in April.
“These are also the only two capital cities where advertised supply is tracking higher than a year ago, suggesting a rebalancing between buyers and sellers is a key factor contributing to the stability of values in these regions.”
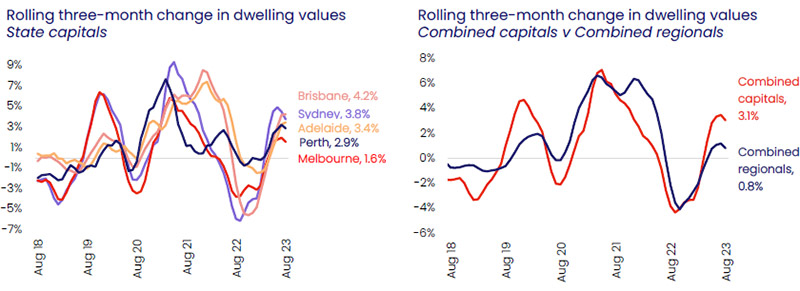
Source: CoreLogic
Within the capital cities, it is generally house values rather than unit values that have showed a sharper recovery trend.
“Most cities are showing a larger rise in house values compared with units, however, Sydney stands out with the most significant difference through the recovery cycle to-date, possibly due to the more substantial decline in house values which fell by 15.0 per cent through the recent downturn,” Mr Lawless said.
South Australia strongest regional market
Conditions across regional housing markets were mixed, with values down over the month across the non-capital city regions of NSW (-0.2 per cent) and Victoria (-0.6 per cent), rising firmly across regional Queensland (0.8 per cent) and SA (0.9 per cent), and holding relatively flat in regional WA (0.1 per cent) and Tasmania (0.0 per cent).
“With internal migration trends normalising across regional Australia, and less demand side pressures from net overseas migration than in capital cities, regional markets generally aren’t seeing the same level of recovery,” Mr Lawless said.
“Historic migration data from the ABS (Australian Bureau of Statistics) shows that prior to the pandemic, regional Australia had only accounted for around 15 per cent of total net overseas migration.
“Housing values across the combined regional areas of Australia are up 1.6 per cent since a trough in February, compared with a larger 6.0 per cent rise in values across the combined capitals.”
Across Australia’s regional markets, areas of the Gold Coast and Sunshine Coast comprised seven of the top 10 markets for the largest capital gain over the three months ending August.
“Coolangatta home values surged 6.2 per cent over the past three months, followed by the Sunshine Coast Hinterland (5.8 per cent) and Gold Coast North (5.6 per cent).
“Strong internal migration into these areas is likely to be a key factor supporting housing demand and housing values in these areas,” Mr Lawless said.
August marked the eighth consecutive month of national home price growth.
PropTrack Senior Economist and report author Eleanor Creagh said it is the longest period of consecutive monthly growth since the pandemic boom when prices rose for 23 months straight between May 2020 and March 2022.
National home prices have now regained the majority of price falls seen in 2022. “For much of this year, stronger housing demand and a limited flow of new listings hitting the market have offset the impact of interest rate rises.
“In Sydney and Melbourne, the flow of new listings is increasing as seller confidence improves, however, buyer demand still far outstrips supply, putting upward pressure on prices.
“Limited choice in Brisbane, Adelaide and Perth, has led to strong buyer competition and solid selling conditions, pushing prices to fresh peaks in August.
“As more new listings come to market over spring, we may see the pace of home price growth start to slow, however, with interest rates stabilised and likely near or at their peak, the confidence in the market is likely to sustain, resulting in more of the country returning to positive annual price growth.”
Supply still low
Although the flow of new listings has lifted through winter, total advertised supply levels remain 15.5 per cent lower than a year ago across the combined capitals and almost 19 per cent below the previous five-year average.
“We have seen vendors becoming more active though winter, which is seasonally unusual,” Mr Lawless commented.
“However most of this fresh stock is being absorbed by the market, with the count of total capital city listings rising by only 3.6 per cent over the past two months, despite the flow of new listings jumping 12.9 per cent.
Across the capital cities, the most substantial rise in total advertised stock levels over the past two months has been in the ACT, where listings are 10.2 per cent higher.
Sydney and Melbourne have also recorded a noticeable lift in total advertised supply, up 9.8 per cent and 8.3 per cent respectively, although both cities continue to record stock levels lower than a year ago.
Advertised supply remains remarkably low in Perth, Adelaide and Brisbane where total listing counts are more than 40 per cent below the previous five-year average and continue to trend lower.


