

Melbourne values stable despite COVID dip
With recent data showing Melbourne’s residential market has been hit hardest among Australian capitals by the novel coronavirus pandemic, longer term measures indicate the city’s house prices are actually reasonably stable.
With recent data showing Melbourne’s residential market has been hit hardest among Australian capitals by the novel coronavirus pandemic, longer term measures indicate the city’s house prices are actually reasonably stable.
Depending on the timeframe chosen, Melbourne’s median house price is up 8 per cent, down 4 per cent, and flat, and all three figures are true at the same time.
Measuring median prices by rolling 12-month periods is the most conservative method for determining market changes.
The median house price for properties sold from July 2019 to June 2020 was $917,000, which is 8 per cent higher than the median house price for properties sold from July 2018 to June 2019 ($851,000).
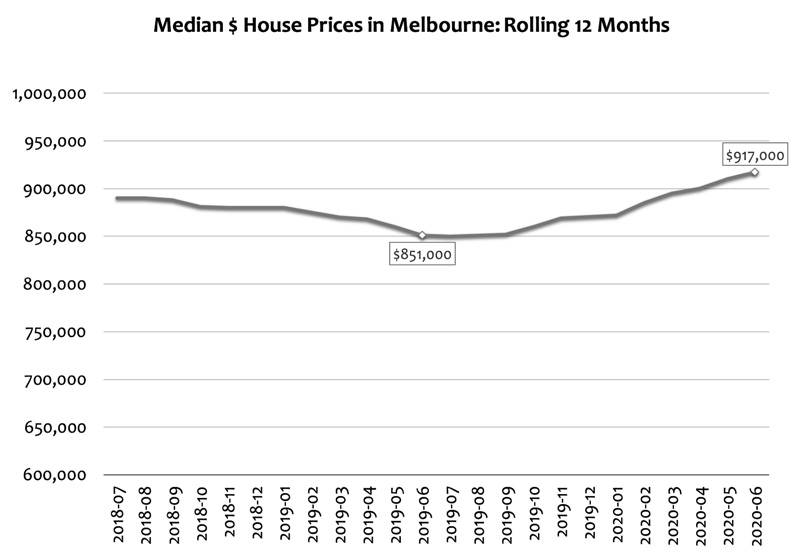
Rolling 12-month medians are useful for long-term trend analyses, but not for identifying emerging changes in the market. Naturally, we’re all very focused on what’s happening now, and what’s likely to happen in the coming months.
Median house prices for properties sold within individual months are shown below.
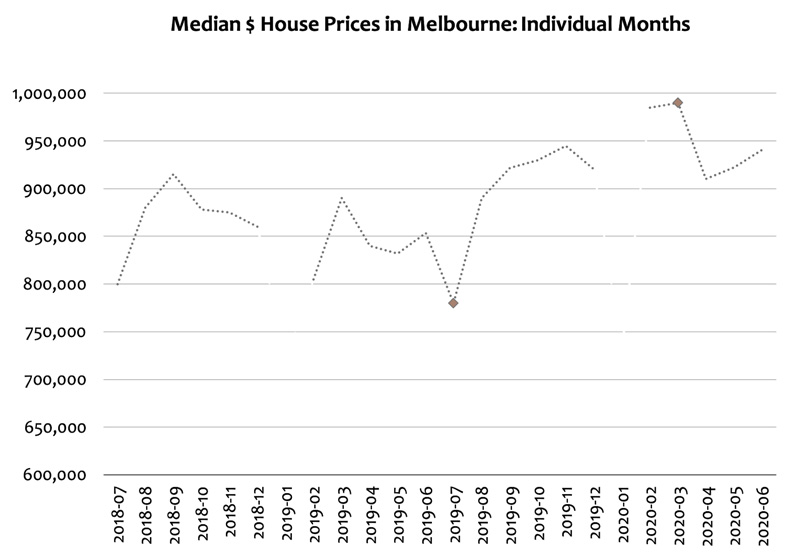
Monthly figures aren’t particularly useful in determining actual percentage changes (unless incorporated into an index or algorithm) but they can be useful in identifying the bottom and top of market cycles.
Momentum in the market is a funny thing, and it’s encouraging to see prices stabilise following the sharp drop in April this year.
Rolling 3-month periods smooth out the dramatic changes seen through monthly analysis and are useful for identifying the emerging trends that rolling 12-month periods can’t.
The below graph shows that in the 3 months since the start of this COVID crisis, Melbourne’s median house price sits at $930,000, which is 4 per cent lower than it was the three months preceding COVID, and nearly exactly what it was at the end of last year.
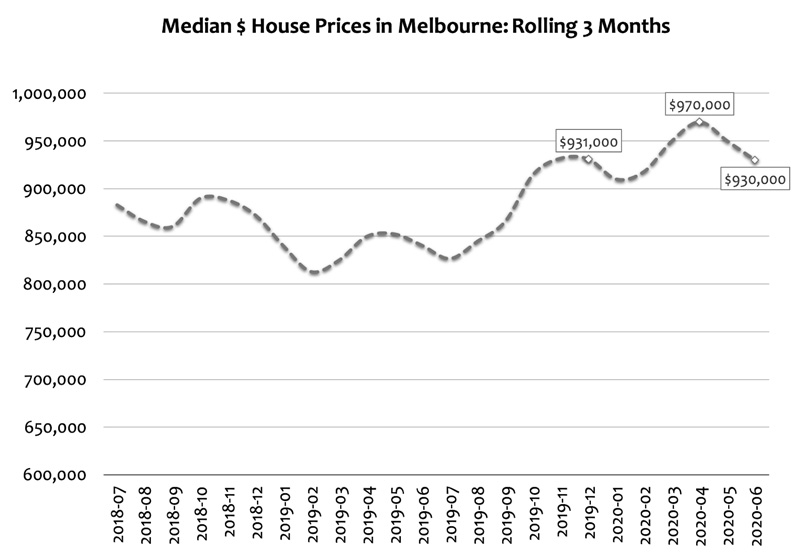
Putting all these methods together in one visual is the best way to make sense of current market conditions. All three point to the same conclusion: Even with the social and economic lockdowns associated with a global pandemic, Melbourne’s median house price has remained pretty stable.


