

Early crisis data shows Melbourne values holding firm
A sharp reduction in the number of vendors listing properties has outweighed shrinking demand due to the COVID-19 crisis, stabilising prices across Melbourne as supply is matched by demand.
A sharp reduction in the number of vendors listing properties has outweighed shrinking demand due to the COVID-19 crisis, stabilising prices across Melbourne as supply is matched by demand.
The below graph shows monthly residential sales volumes and house prices across Melbourne since the beginning of 2019, apart from January which traditionally shows low levels of activity.
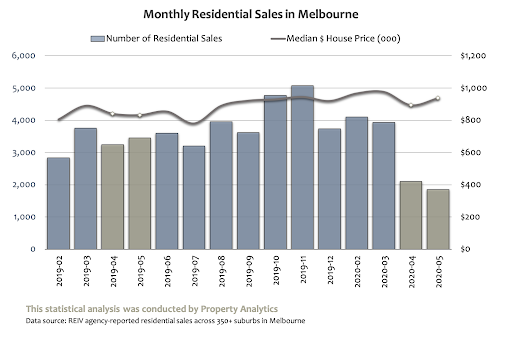
After bottoming out in mid-2019, the market began to gather some positive momentum. Prices started to gradually increase, as did sales volumes, which were up in February and March 2020 year-on-year.
COVID bit hard from April, and the upward trajectory of house prices stopped. Sales Volumes dropped significantly in April and May 2020, down about 40 per cent year-on-year.
There is little doubt that house prices today are lower than they would have been without the spread of COVID-19 and associated government-mandated lockdowns. But, importantly, values haven’t nose-dived. In fact, they remain higher than they were at the same time last year.
It’s risky to take too many insights out of just two months of activity. Most analyses of house prices are based on 12-months’ worth of sales, or at least a quarter’s worth. But, we’re in unprecedented times, and people are rightly asking questions about the here and now.
The below graph shows how house prices over the last 2 months (April-May 2020) compare to house prices over the last 12 months (June 2019 – May 2020) across every council area in Melbourne.
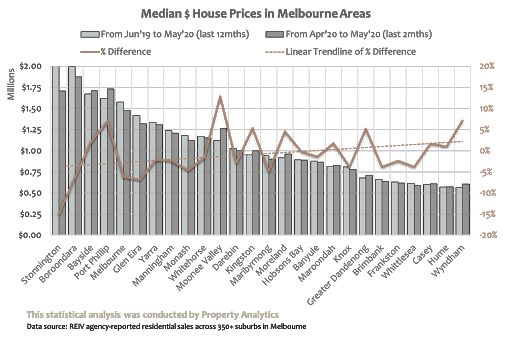
This graph is not designed to say house prices are up exactly X per cent or down Y per cent. However, it does illustrate a couple of things quite clearly:.
- Prices are only slightly up or slightly down in most areas
- Greater falls look to be occurring in areas with the highest house prices
Statistical analyses can only take you so far to understanding market trends. Anecdotal feedback across Melbourne has been pretty mixed. In some areas, agents are talking prices 10 per cent lower than they were just a few months ago, whereas in other areas, agents are surprised by the strength of buyer demand and subsequent price results.
We are only just beginning to analyse results by different price segments, property types, and buyer demographics. What is clear now though is that the sky has not fallen on the Melbourne residential real estate market.
We will know much more through the spring market, when more stock comes up for sale. Future house prices will depend greatly on how the broader economy performs.


