

Brisbane takes title for fastest rising house prices
House prices are rising faster in Brisbane than anywhere else in the country, with supply levels continuing to fall short of buyer demand and competition for desirable dwellings being bolstered by interstate investors.
House prices are rising faster in Brisbane than anywhere else in the country, with supply levels continuing to fall short of buyer demand and competition for desirable dwellings being bolstered by interstate investors.
The number of properties available for sale in Brisbane was 31.3 per cent lower for the four weeks ending October 3, compared to the equivalent period last year, according to CoreLogic.
New listings over the same period were 2.3 per cent higher in Brisbane, which really is not enough to satisfy the demand from buyers.
Demand is still extremely high, especially for detached houses throughout the inner and middle ring suburbs.
Auction clearance rates, according to Domain, have remained historically high for Brisbane being recorded at 69 per cent through to 88 percent every weekend throughout October.
This is unusual for Brisbane which traditionally has not had the same appetite for auctions compared to Sydney and Melbourne.
It seems this trend is gradually changing as both buyers and sellers become more confident in this way of transacting property.
Westpac released their property price forecasts recently, which indicated that the Brisbane home values were expected to grow 22 per cent per cent in 2021 (which has actually already been exceeded) and then a further 10 per cent in 2022.
Based on the imbalance between supply and demand throughout the city, we also expect prices to continue to escalate.
It is acknowledged that recent moves by regulators to restrict lending to property buyers will decrease the borrowing capacity of new buyers by about 5 per cent.
This is, however, likely to have a much higher impact in the regions where there is the largest gap between property prices and incomes.
The table below highlights the price to income ratios for dwellings, houses and units in each of the three largest capital city markets. Incomes were assessed based on the Greater City Regions from the 2016 Census, whereas median values as at the 1 November 2021 have been used.
| Location | Sydney | Melbourne | Brisbane |
|---|---|---|---|
| Weekly Family Incomes | $1,750 | $1,542 | $1,562 |
| Annualised Family Incomes | $91,000 | $80,184 | $81,224 |
| Median Value – Dwellings | $1,071,709 | $780,303 | $642,097 |
| Median Value – Houses | $1,333,767 | $972,659 | $731,392 |
| Median Value – Units | $837,262 | $621,898 | $437,086 |
| Dwelling Price to Income Ratio | 11.8 | 9.7 | 7.9 |
| House Price to Income Ratio | 14.7 | 12.1 | 9.0 |
| Unit Price to Income Ratio | 9.2 | 7.8 | 5.4 |
Obviously, it is important to also consider the disparity between property prices and incomes at a more local level, however when we review this information, the majority of areas with the largest gaps between prices and income levels are also in Melbourne and Sydney. A recent report by RiskWise, showed that prices in the eastern suburbs of Sydney were more than 22 times the typical income of residents, whilst northern beaches and north shore prices were 15 times income levels.
In Melbourne, the regions most affected were in the inner east and inner south, along with the Mornington Peninsula with prices in these locations more than nine times income levels.
RiskWise founder, Doron Peleg, said buyers were already stretching themselves to get into these markets and a reduction in borrowing capacity would have “noticeable impact on market dynamics.”
Because Brisbane is a much more affordable market as a whole, there is likely to be less risk that the recent changes will impact the market in the foreseeable future.
Queensland also has recently seen a surge in the number of job advertisements with an 8.5 per cent increase to the end of September 2021.
Over the last 12 months the number of job advertisements has increased 54.1 per cent across the state, which is a strong result.
This is reassuring as local businesses appear to be more enthusiastic about the months ahead, perhaps in part due to the borders opening up in the near future.
With the strongest market movements across October, it is important to recognise that not all areas throughout the city are performing the same way. Let’s take a deeper look into the performance of the Brisbane market throughout October 2021.
Brisbane property market prices
The latest Hedonic Home Value Index data by Corelogic released on November 1, showed the median dwelling value in Brisbane increased by 2.54 per cent in October, which is 0.75 per cent higher than last month.
This level of growth confirms that in Brisbane, the momentum of price growth across the city is picking up once again.
The current median value for dwellings across Greater Brisbane is $642,097 which is $16,806 higher than just one month ago.
The quarterly growth in dwelling values across Greater Brisbane has now jumped to 6.5 per cent, an apparent pick up since last month, and annual growth for the last 12 months is now 22.3 per cent.
The top end of the Brisbane market is still driving the growth, with the strongest growth in dwelling values is still within the top end of the market.
In the three months to September 2021, the top 25 per cent of values experienced 6.7 per cent growth in that market segment compared to 4.2 per cent growth in the lowest quartile of values across the city.
While both the highest value and lowest value segments of the market continue to show growth over the last 3 months, the rate of growth at the top end continues to outperform, when comparing the month-on-month trends.
Brisbane house prices
Detached house values increased by 2.8 per cent in October, a gain substantially higher than the 2 per cent growth recorded in September.
This is the highest monthly growth recorded for Brisbane in the current property boom. The 12 month change in Brisbane house prices has been 24.8 per cent.
The current median value for a house in Greater Brisbane is currently $731,392, the highest it has ever been. This is $22,156 MORE than one month ago!
Brisbane unit prices
The unit market in Brisbane recorded a further pickup also. After a slower month throughout September when greater Brisbane Units grew 0.6 per cent, October experienced an increase of 1.3 per cent growth.
The 12-month growth for units across Brisbane is now 10.4 per cent. The current median unit price in Brisbane is $437,086, which is $7,086 more than one month ago.
Summary of price growth in Brisbane for the year to date
The graph below charts the percentage change in property values for Houses and Units since January 2020 for both houses and units in Greater Brisbane.
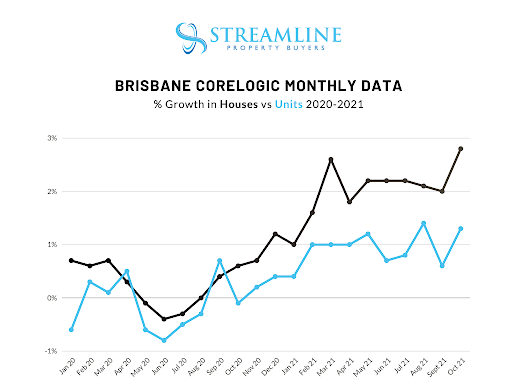
The trendlines here show that the housing sector is continuing to outperform the unit sector on a month-to-month basis. This has been a trend observed since October 2020. This graph also demonstrates the large spike in price growth throughout the last month in Brisbane, especially in the housing sector of the market.
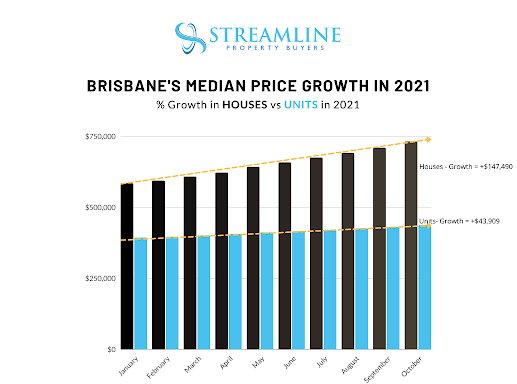
Below we have charted the actual median value changes for Houses and Units across Greater Brisbane since January 2021. You can see Houses have increased $147,490 over the last 10 months, whereas units have increased $43,909 across the same period of time.
Brisbane rental market movements
Vacancy Rates at a city-wide level in Brisbane increased slightly between August and September, shifting to 1.4 per cent.
In the months prior, vacancy remained unchanged at 1.3 per cent since May this year.
The small increase in the City-wide values has come from the inner-city locations. The table below highlights where vacancy rates across Brisbane sit at the end of September 2021.
| Region | Vacancy Rate September 2021 (change from August 2021) |
|---|---|
| Beenleigh Corridor | 0.6% (+0.1%) |
| Brisbane CBD | 4.9% (+0.3%) |
| East Brisbane | 1.4% (+0.1%) |
| Inner Brisbane | 2.5% (+0.2%) |
| Ipswich | 0.8% (-) |
| Northern Brisbane | 0.7% (-) |
| South East Brisbane | 0.8% (-) |
| Southern Brisbane | 1.5% (+0.1) |
| West Brisbane | 1.2% (-) |
Source: SQM Research
The Brisbane CBD saw a further increase in vacancy this month, so this is a firm trend that we have seen for the last three consecutive months.
Additionally, in the Inner Brisbane location vacancy looks to be trending upwards also.
The rest of Great Brisbane remains low with limited stock available for tenants. This is especially evident in the middle and outer ring locations of Greater Brisbane.
Tight vacancy rates are contributing to rental price growth throughout Brisbane.
Housing rents have recorded annual growth in Brisbane of 11.4 per cent, according to CoreLogic, which is up a further 0.6 per cent compared to one month ago.
Rental incomes in the unit market throughout Brisbane have seen an annual increase of 6.5 per cent up 0.3 per cent compared to last month.
Gross rental yields for dwellings across all of Greater Brisbane according to CoreLogic remained at 3.9 per cent throughout October. This remained unchanged compared to last month.
What did we see on the ground across Brisbane during October?
We have noticed the huge stretch factor that some buyers are putting forward to secure quality properties throughout the city.
When we consider the prices that have been achieved at auctions over the most recent few weeks, it is hard to look back and see what we were previously paying for similar properties just a few short months ago.
The rate of the market movement throughout Brisbane has been truly incredible.
Of course, the buyer depth varies throughout different suburbs around the city. While the market is strong, even C-Grade properties are selling fast as buyers are making compromises just to get into the market.
Many have forgotten the significant impact of the floods 10 years ago and paying top dollar for properties in flood zones. Main road properties are also being snapped up by buyers who are just trying to get into the market and are otherwise priced out of those locations.
Of course, we never recommend making these types of compromises when property is typically held for longer periods of time.
At some stage the market will turn. We always recommend buying the types of properties that will be in high demand despite market conditions.
But regardless of these types of impacts, there seems to be multiple buyers for every property in Brisbane right now.
The further away from the CBD that we look, generally the buyer depth starts to thin out more and more.
Obviously there is a related scarcity factor in that trend, which is something buyers need to be aware of when hoping to achieve both short term and more sustained long term capital growth.
The months ahead …
We do not expect to see prices stabilise in Brisbane for some time yet. We are confident that prices will continue to grow, especially in the housing sector where the demand is the strongest throughout the city.
Buyer inquiry is still strong, especially from property investors who are priced out of the more expensive southern capital cities.
While the demand for more affordable property remains strong, we expect to see property values continue to rise.
There will be a slow down in the weeks leading up to Christmas, where listing volumes will decline and perhaps buyers will focus more on Christmas shopping rather than property shopping. We then expect a resurgence in the new year. Of course, time will tell.


